From Assumptions to Actionable Intelligence
The single pane of glass for your entire Camunda 7 process landscape. Transform business processes with AI-powered analytics, real-time monitoring, and intelligent optimization.
Supercharge your Camunda BPMN Cockpit and Optimize with Champa Intelligence!
Watch How Teams Transform Their Camunda Operations
Real features, real workflows, real results. Choose your journey:
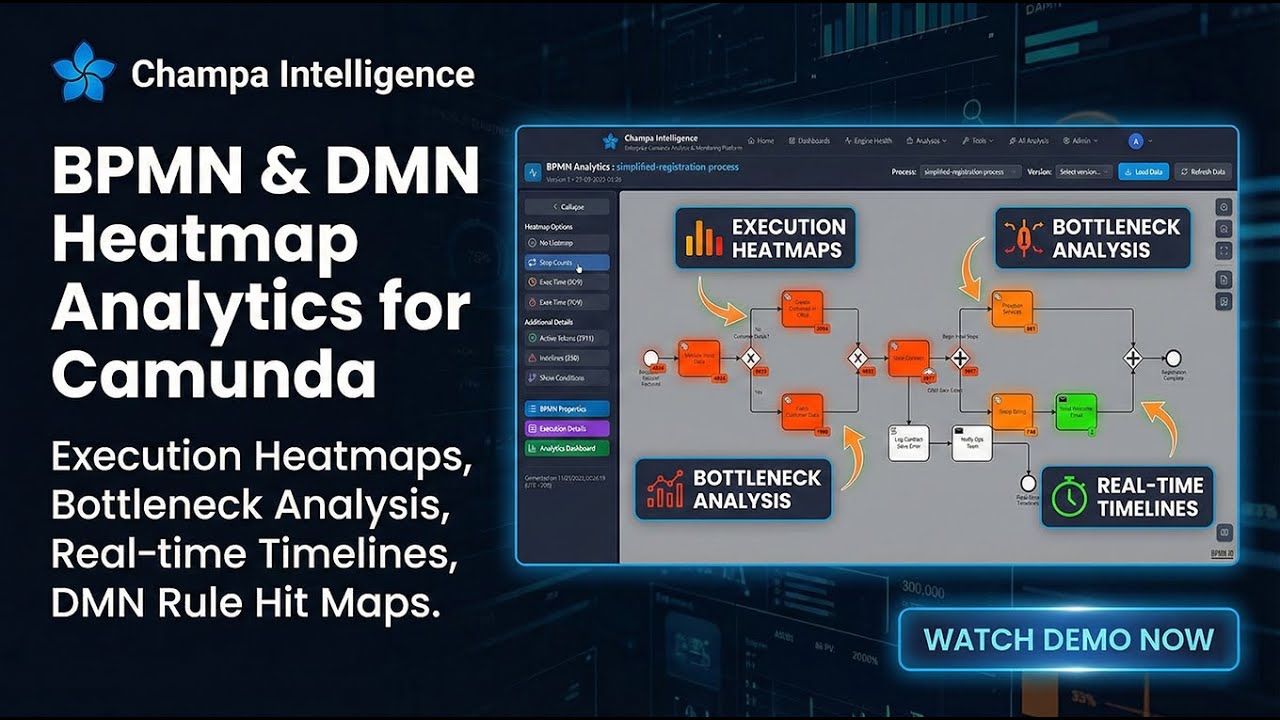
BPMN & DMN Heatmap
Visualize bottlenecks in real-time
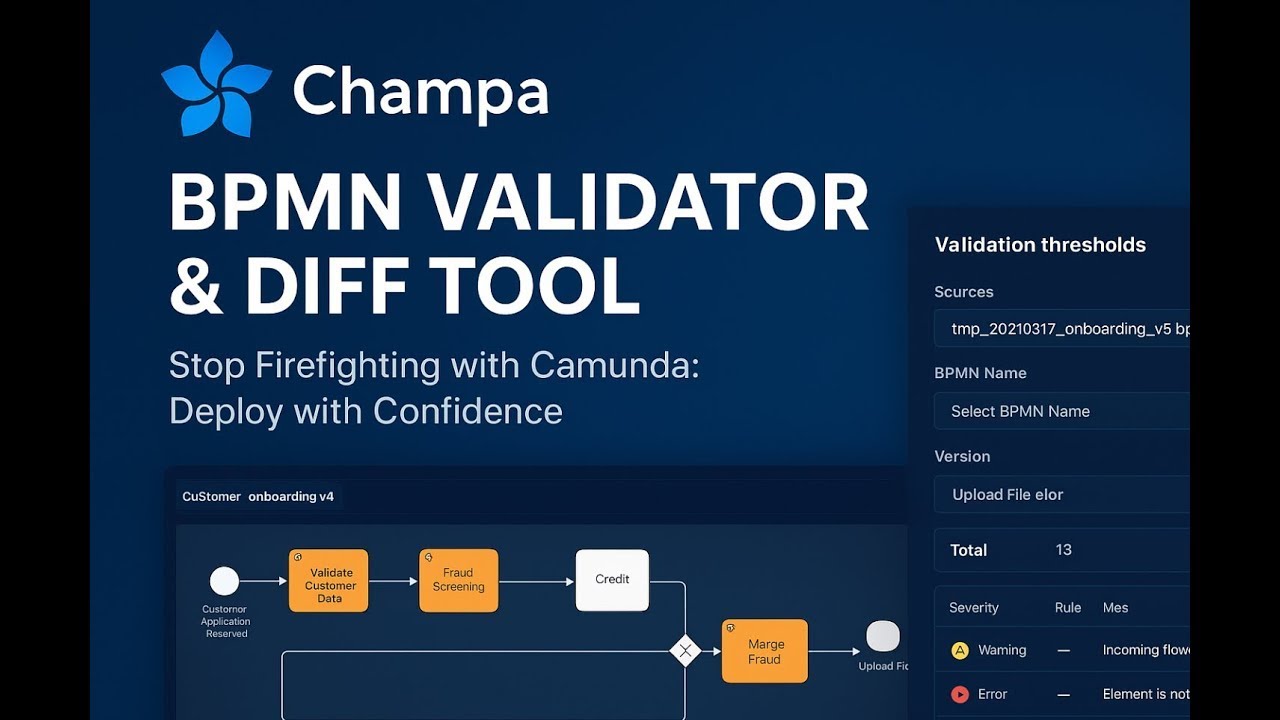
Visual BPMN Diff
Compare process versions with zero guesswork
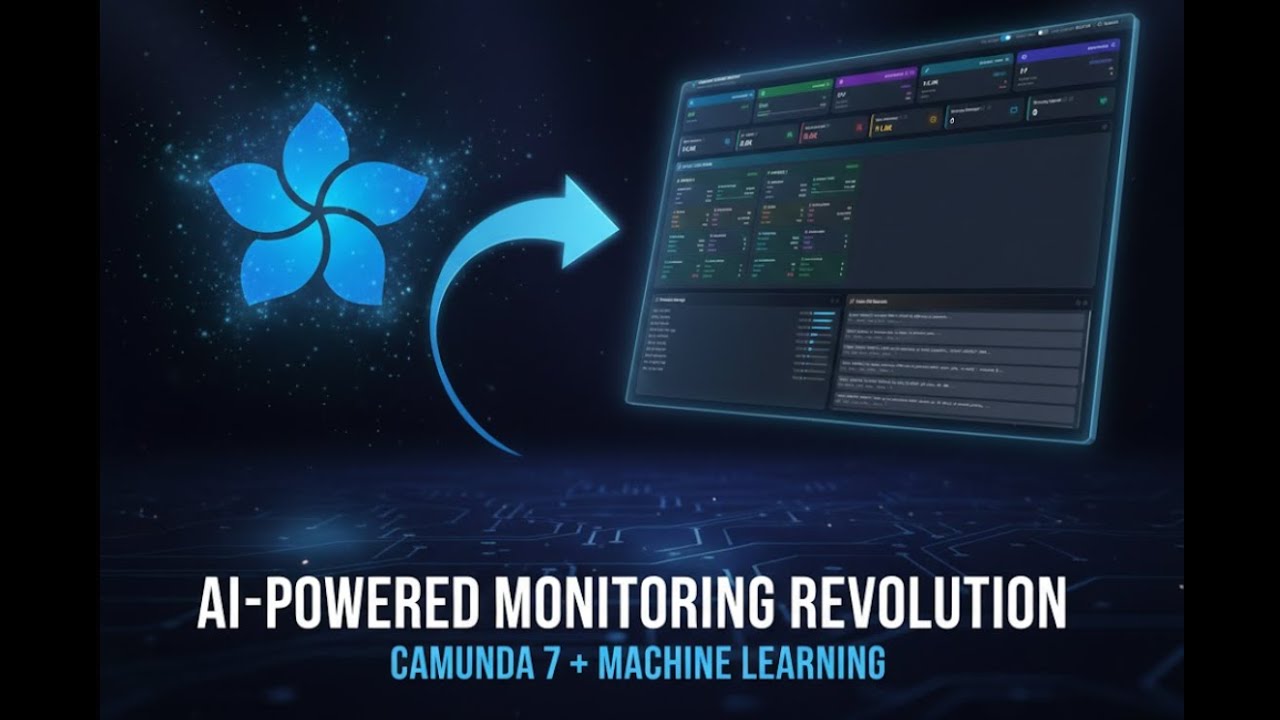
Monitoring Revolution!
ML-Powered Monitoring with Incident Intelligence
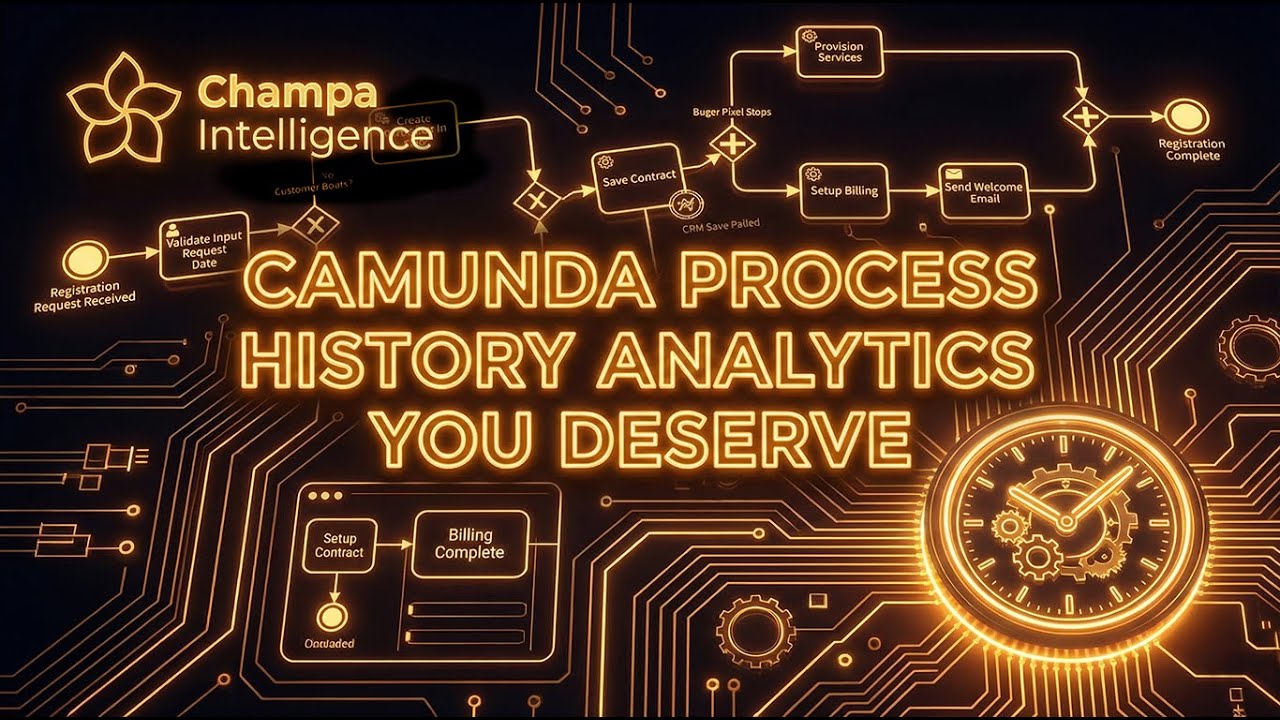
Historical Process Analysis
Process Portfolio & Details
Want to see more? Visit our YouTube channel
Platform Comparison
Why Organizations Choose Champa Intelligence
A fair, comprehensive comparison showing how Champa Intelligence complements and extends your Camunda investment—whether you're on Community or Enterprise Edition.
Perfect for Camunda CE Users & Forks
Upgrade without the enterprise price tag. Get powerful analytics, monitoring, governance features and developer tools that don't exist anywhere else. Leapfrog directly to AI-powered intelligence.
Works perfectly with CE forks: Operaton, CIB Seven, eximeeBPMS — all tested and fully compatible out-of-the-box.
Force Multiplier for Camunda EE
Supercharge your existing investment. Add unique developer tools (BPMN Diff, Model Validator), AI-powered diagnostics, and unified health monitoring that don't exist in standard EE — all in a single pane of glass.
Complement, Don't Replace
Designed to work alongside Camunda. Whether you're using CE or EE, Champa Intelligence seamlessly integrates to provide capabilities that extend — not replace — your Camunda investment. Extend your Camunda 7 lifetime with modern observability and AI-powered insights without the pressure to migrate. Deploy with confidence.
Building on Camunda 7 or its Forks?
Let's Partner.
We invite solution providers, system integrators, and companies building on Camunda 7 (or forks like Operaton, CIB Seven, eximeeBPMS) to explore partnership opportunities.
Two Editions Available
Complete observability and AI analytics for enterprise teams
- All features included
- Updates & support
Full source code access for OEM partners and deep integrations
- Complete source code
- OEM/resell rights available
- Custom agreements
Choose Your Path
Different roles, different priorities. Find what matters to you.
For Technical Teams
Developers, Architects, DevOps & SRE looking to eliminate firefighting and debugging time.
- AI-powered root cause analysis
- Visual BPMN diff & validation tools
- Real-time cluster health monitoring
For Business Leaders
CEOs, VPs, Process Owners focused on measurable ROI and operational excellence.
- 85% downtime reduction
- 1-3 month ROI timeline
- Real-time business KPIs
For Solution Partners
Building on Camunda 7 or forks? Explore OEM, reseller, and co-development opportunities.
- Enterprise Edition with source code
- OEM & reseller programs
- Custom partnership terms
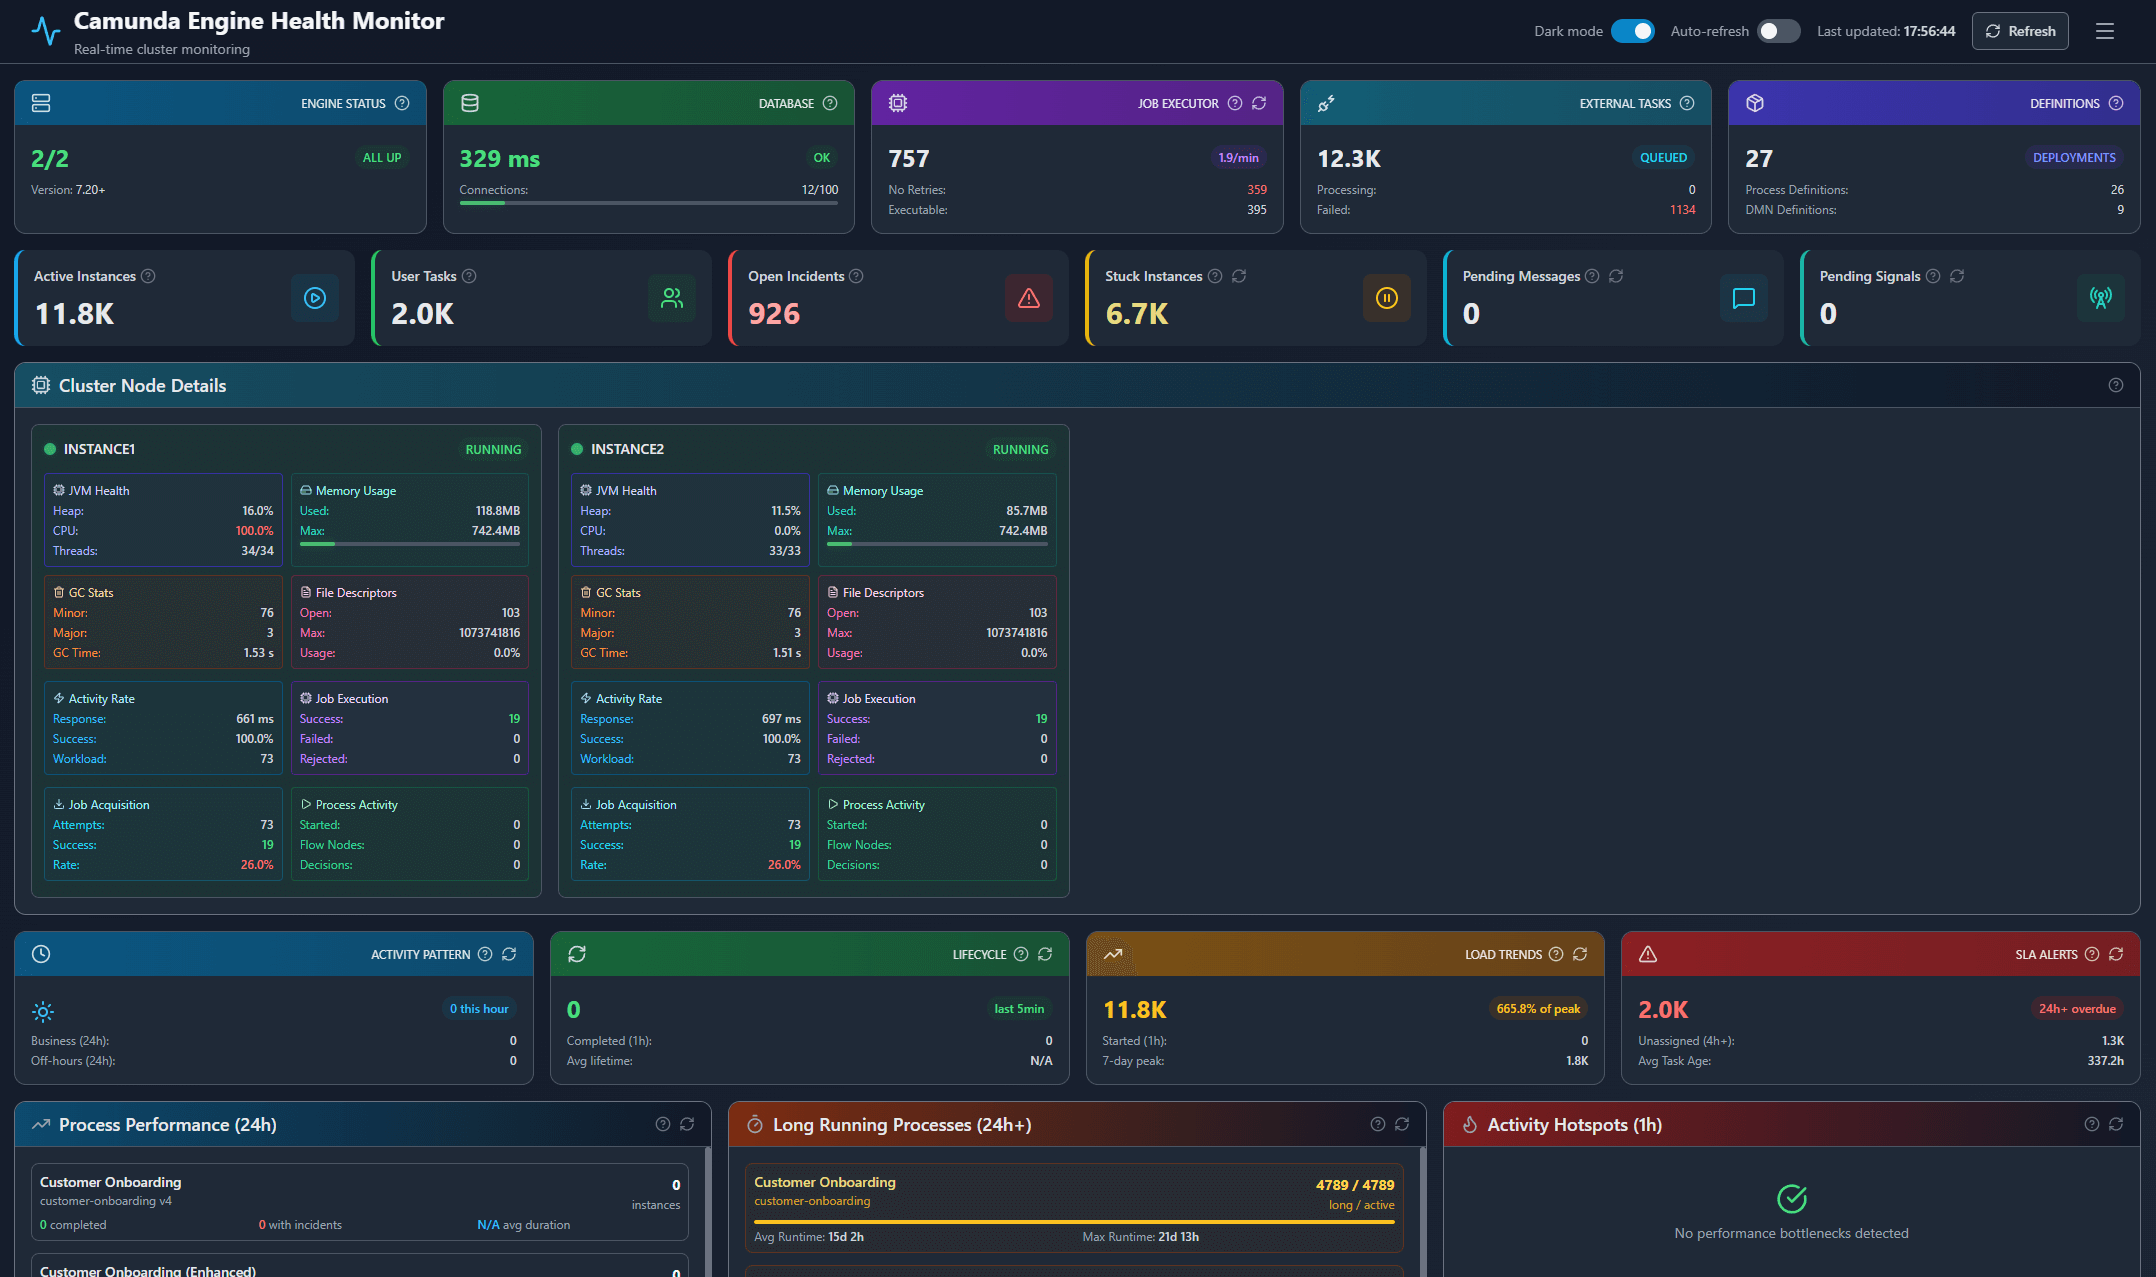
Real-Time Observability
Holistic Engine Health Monitoring
Go from reactive alerts to proactive system management. Gain complete, real-time visibility into your entire Camunda cluster's health and performance with comprehensive diagnostic metrics.
- Monitor every node across your distributed cluster with live performance metrics
- Identify and resolve database bottlenecks before they impact operations
- Prevent downtime with proactive JVM and memory monitoring
- Track API response times and throughput across all endpoints
Historical Intelligence
Deep Process Analytics & Performance Insights
Turn historical data into strategic insights. Understand the "why" behind your process performance with comprehensive analytics that connect operational metrics to business outcomes.
- Unify all operational data in a single, comprehensive dashboard
- Pinpoint and eliminate process delays with root cause analysis
- Track KPIs and SLAs with automated alerting for threshold violations
- Identify optimization opportunities through pattern recognition
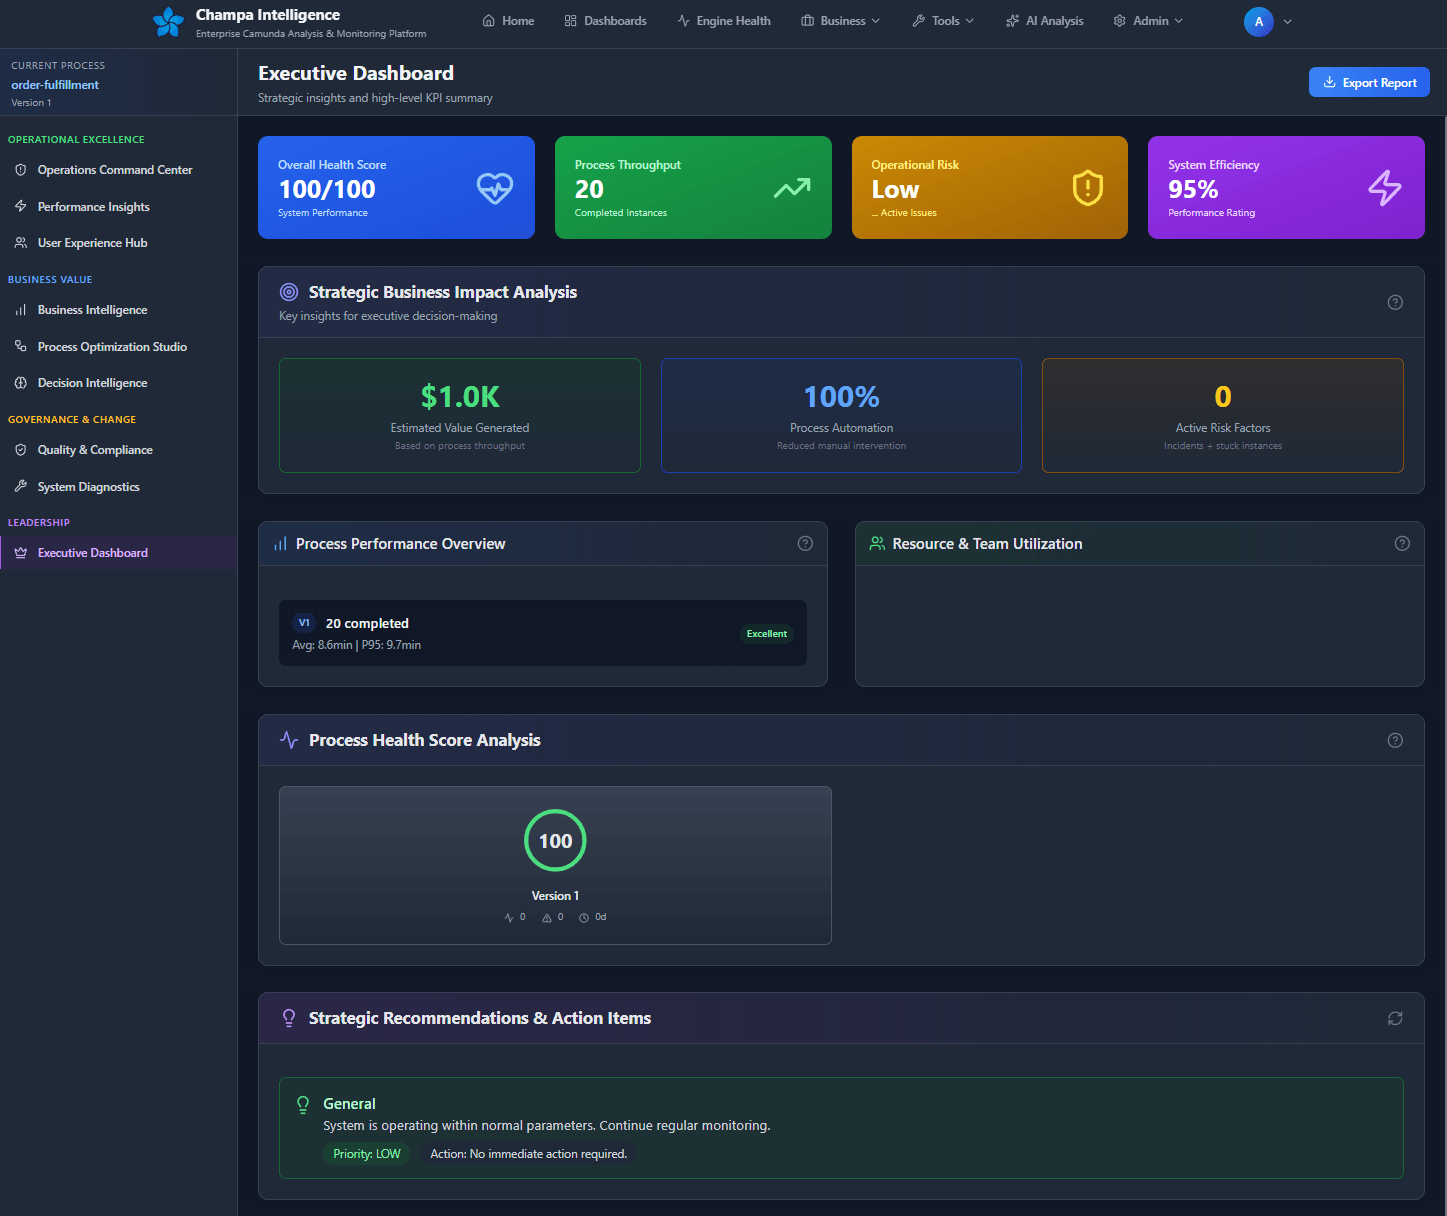
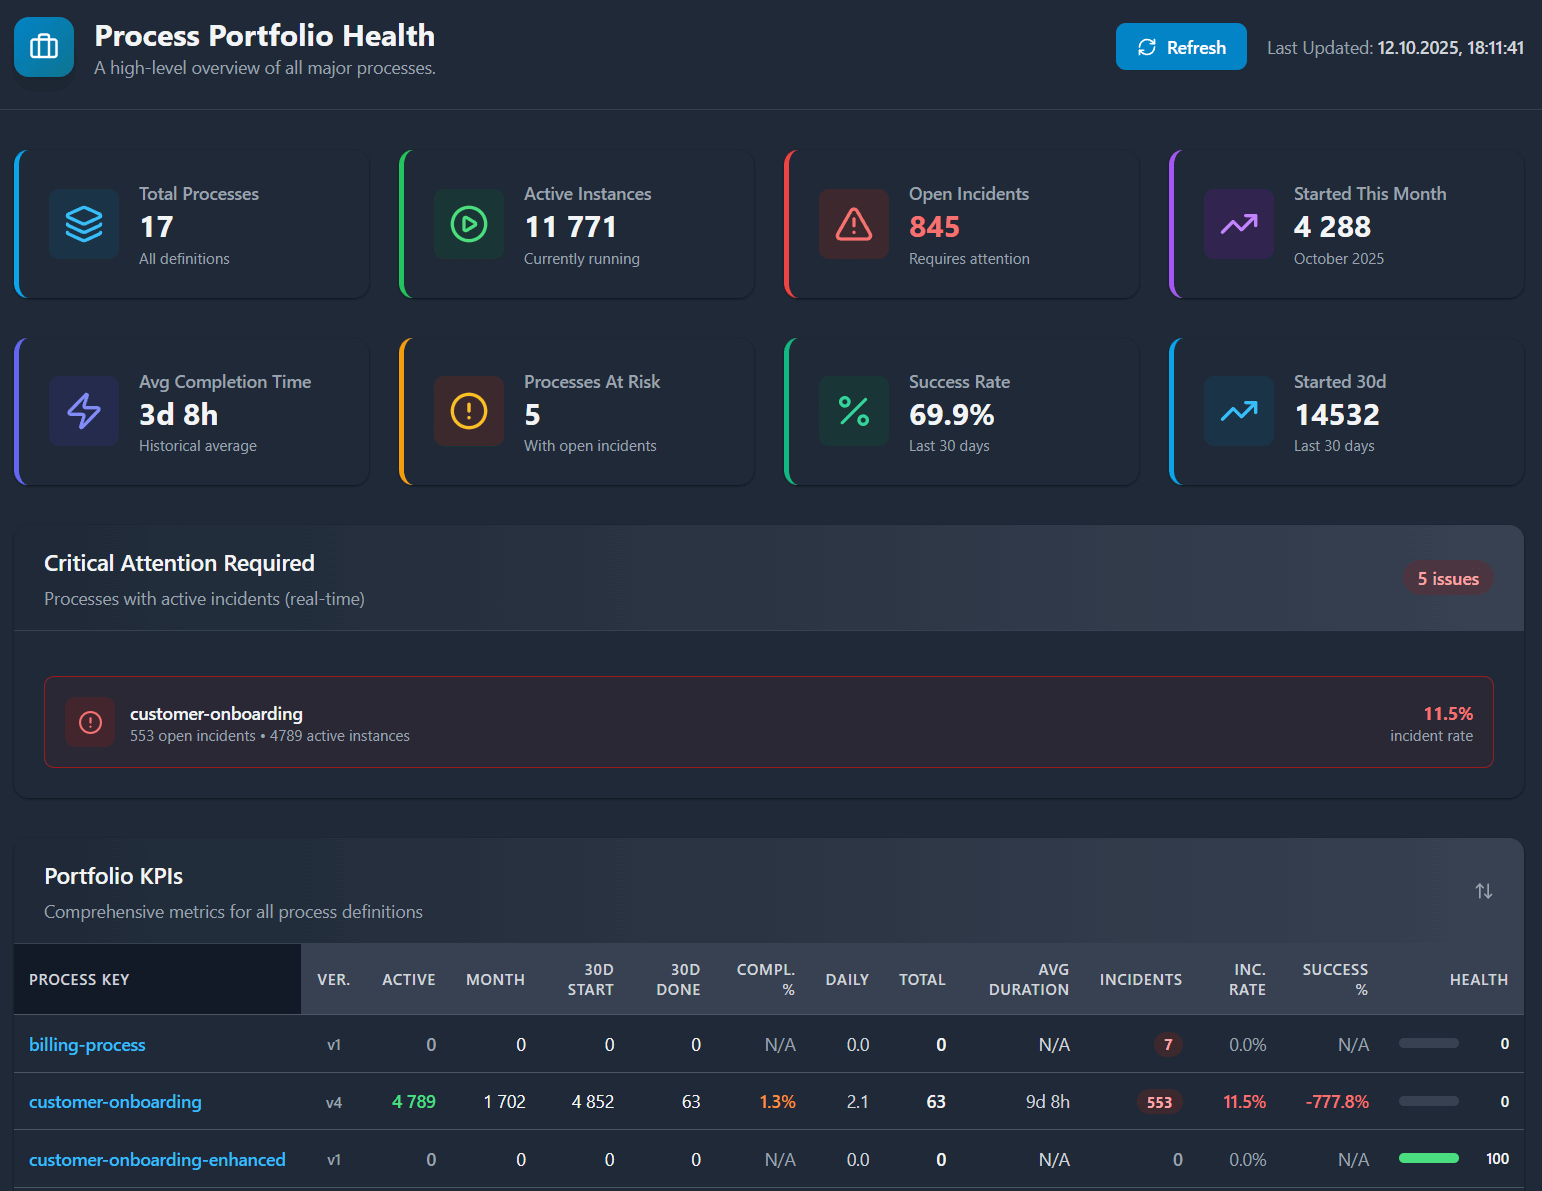
Business Intelligence
Strategic KPI Mapping for Process Owners
Connect process performance directly to business outcomes. Empower business and process owners with strategic metrics that demonstrate ROI and guide data-driven decision making.
- Visualize business impact with cost-per-instance and throughput metrics
- Track compliance rates and SLA adherence in real-time
- Receive AI-driven recommendations to reduce cycle time and costs
- Generate executive reports with business-focused analytics
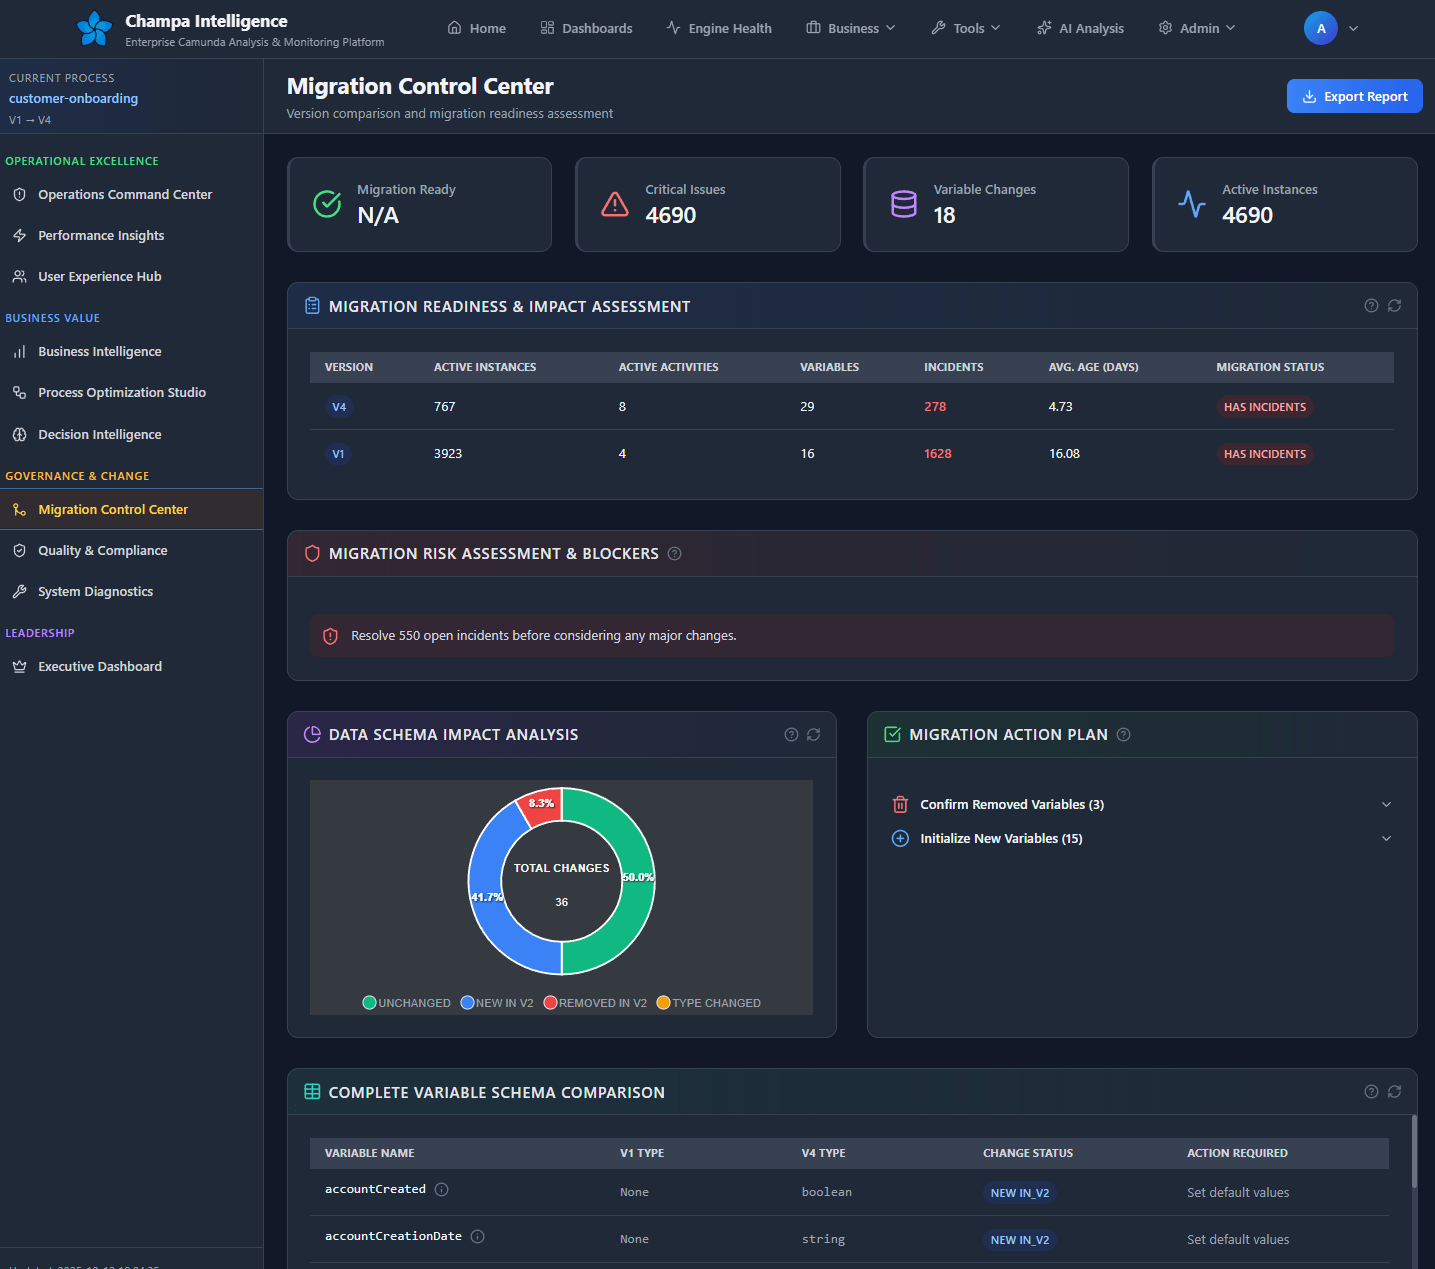
Change Management
Intelligent Version Comparison & Impact Analysis
Deploy changes with confidence. Visually compare any two process versions to understand the impact of every modification before deployment, ensuring smooth transitions and minimizing risk.
- Visualize structural changes directly on BPMN diagrams with color-coded overlays
- Measure real-world performance impact of process modifications
- Ensure data schema compatibility across version migrations
- Track deployment history and rollback with full audit trail
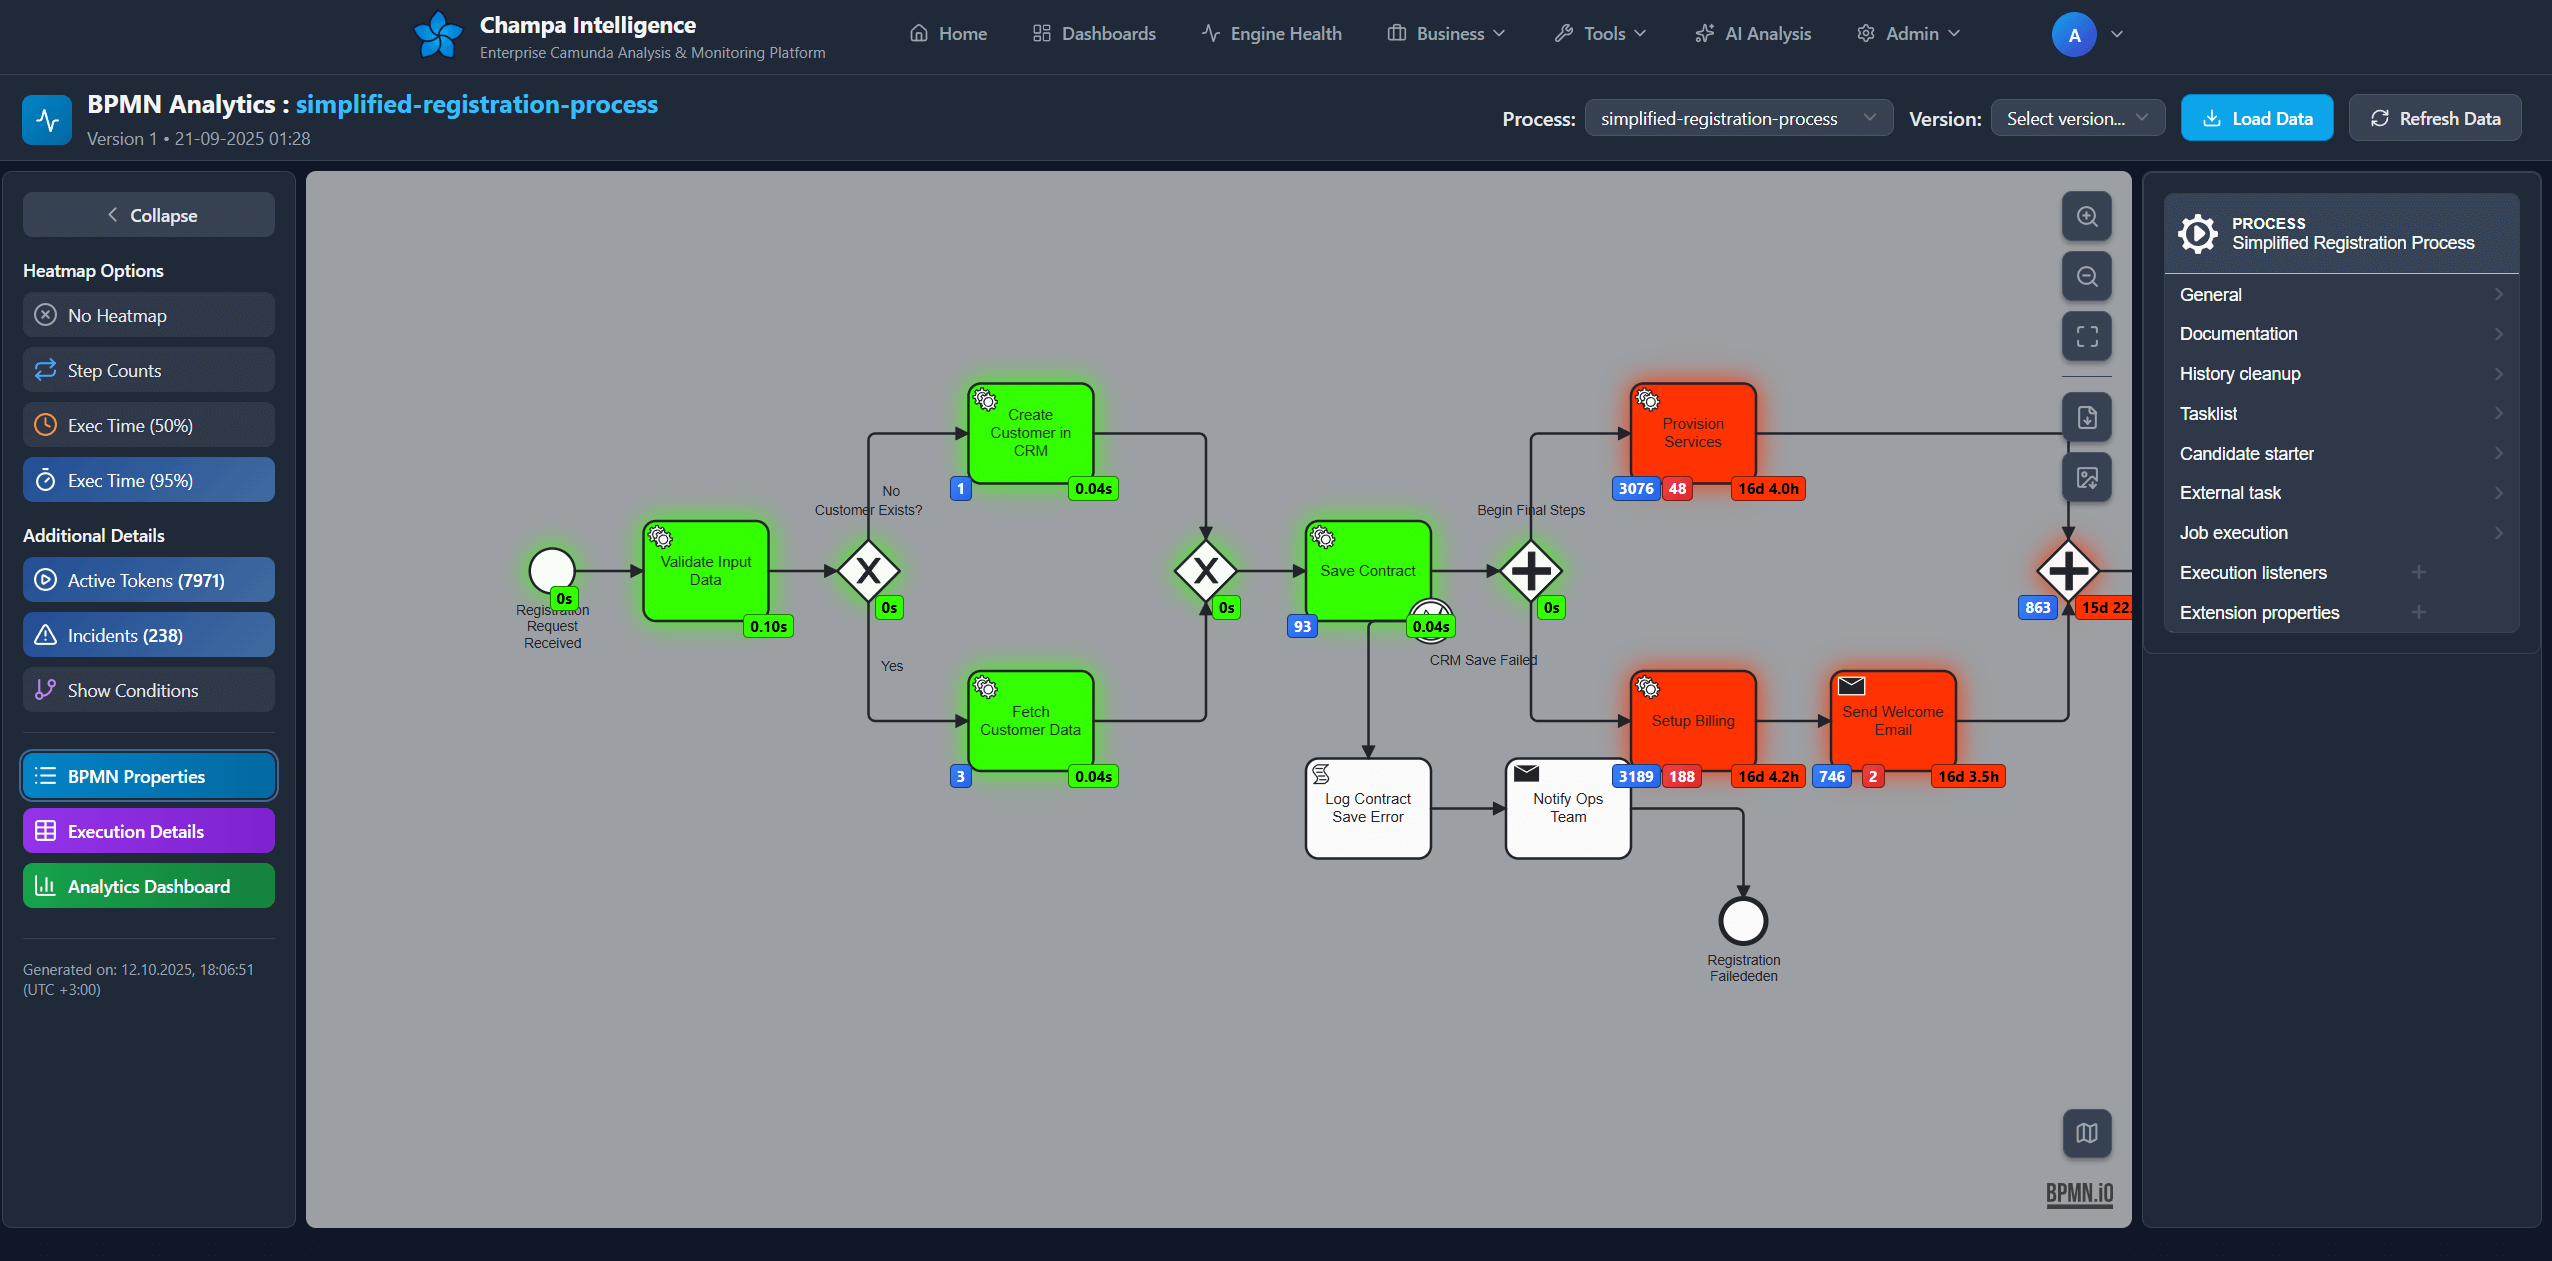
Interactive Visualization
Live Process Heatmaps & Bottleneck Detection
Bring your BPMN models to life. See exactly how your processes and decisions are performing with intuitive visual overlays that highlight execution patterns and performance bottlenecks.
- Discover the most common execution paths with frequency heatmaps
- Instantly spot performance bottlenecks and slow task execution
- Analyze decision table outcomes and business rule effectiveness
- Visualize token flow and identify concurrent execution patterns
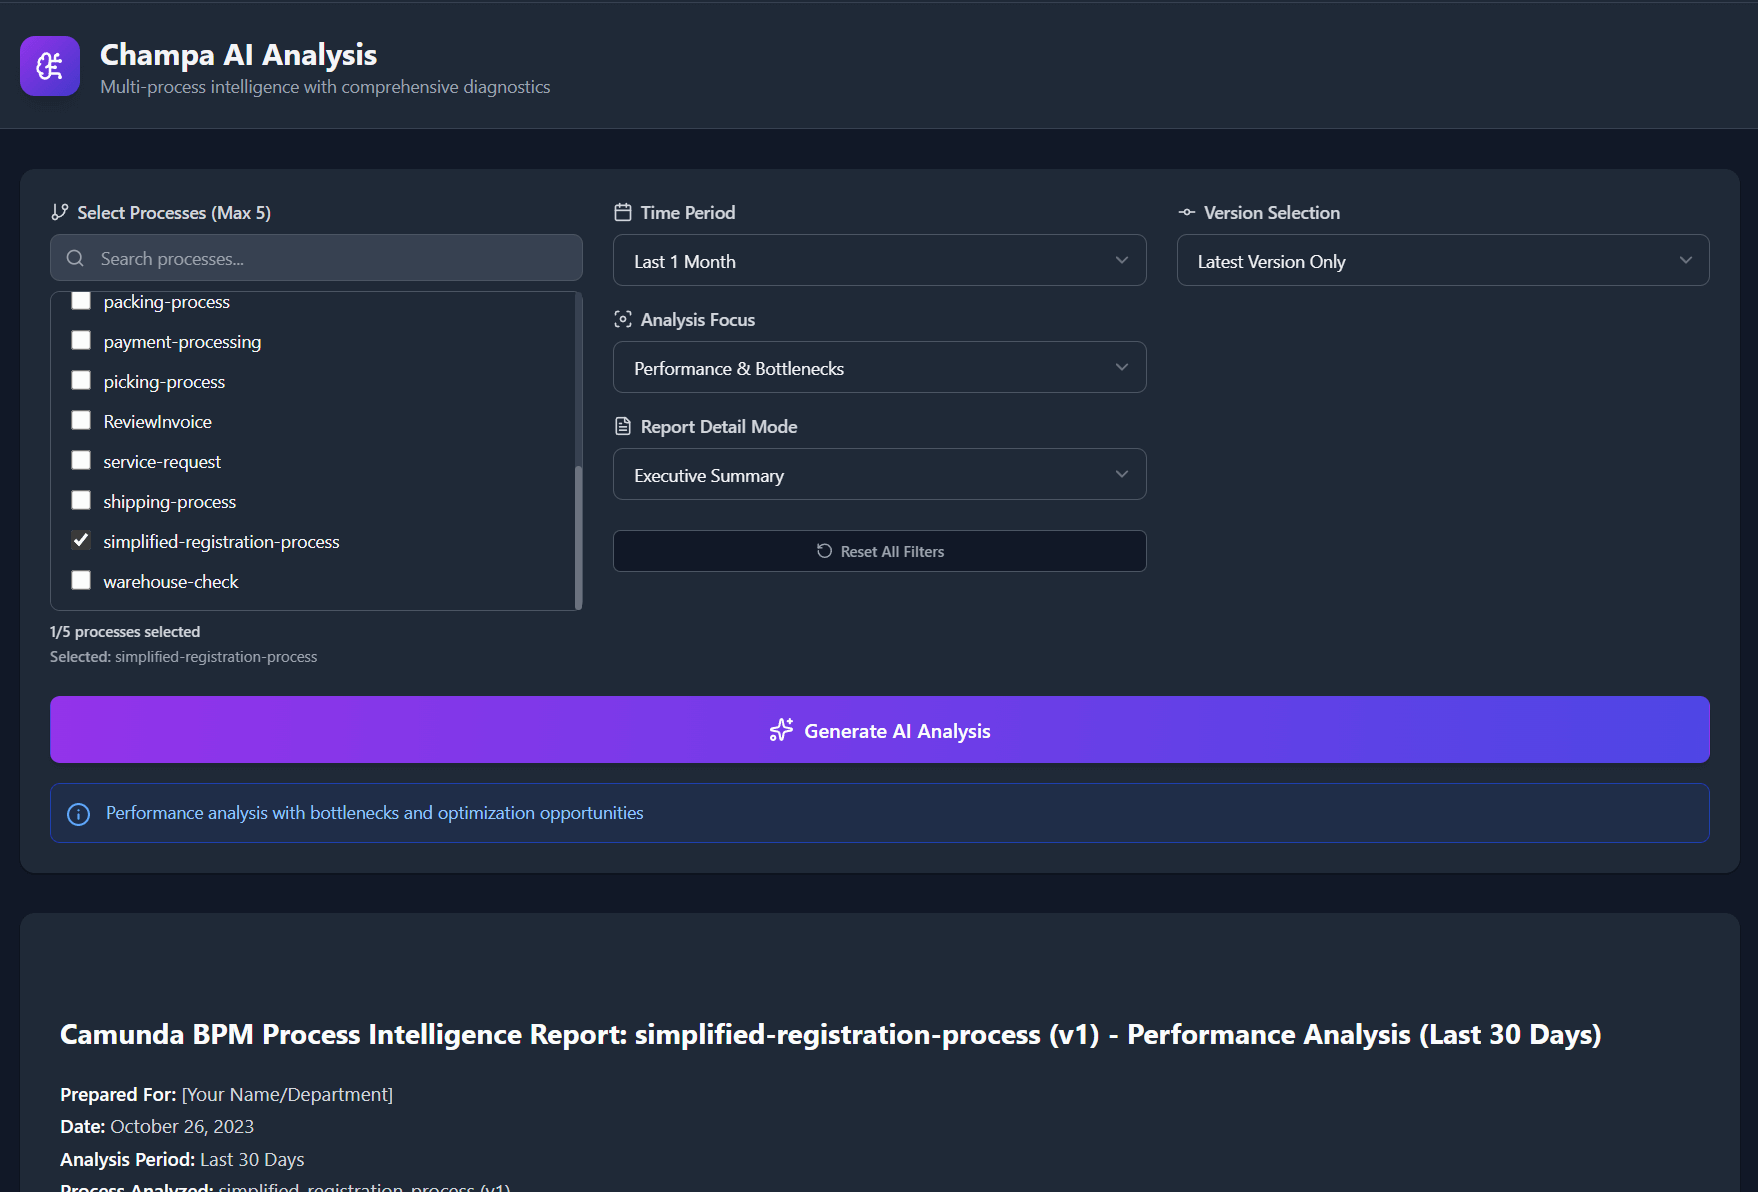
AI-Powered Diagnostics
Automated Root Cause Analysis & Recommendations
Go beyond dashboards. Ask complex questions in natural language and receive automated diagnostics with actionable recommendations powered by advanced AI analysis.
- Automatically surface hidden process issues and anomalies
- Receive data-driven optimization ideas based on historical patterns
- Identify emerging performance trends before they become problems
- Query your process data in natural language for instant insights
Quality Assurance
Automated Quality Gates & Compliance Validation
Build better, more compliant processes from the start. Automatically validate models against best practices, enforce design standards, and detect security risks before deployment.
- Enforce organizational design standards and naming conventions automatically
- Eliminate common modeling errors with 50+ automated quality checks
- Proactively identify sensitive data exposure and security vulnerabilities
- Generate compliance reports for audit and governance requirements

Stop Context-Switching.
Start Actually Solving Problems.
Six battle-tested tools that transform your team from firefighters into problem-solvers. Each one eliminates hours of manual work and answers the questions your tools can't.
AI Root Cause Analysis REST API Ready
Stop manually correlating logs, variables, and metrics. Ask in plain English, get answers in seconds.
AI Response (12s): "Payment gateway timeout. 23% failure rate after v47 deployment. Timeout config 5s → should be 15s. Also recommend async pattern + circuit breaker."
Automated BPMN/DMN Validator 50+ Rules
Your quality gate before production. Catch mistakes that cost hours to debug—in seconds during development.
Developers: 4-6 hours debugging production issues caught by validator
ROI: 15-20 hours/month per team
Visual BPMN Diff Tool Unique
Deploy with confidence. See every change between versions—visually and in XML—before it hits production.
PR reviews, migration planning, impact analysis—all instant instead of painful.
Production Heatmaps BPMN + DMN
See how your processes actually behave in production. No guessing. Just data overlaid on your diagrams.
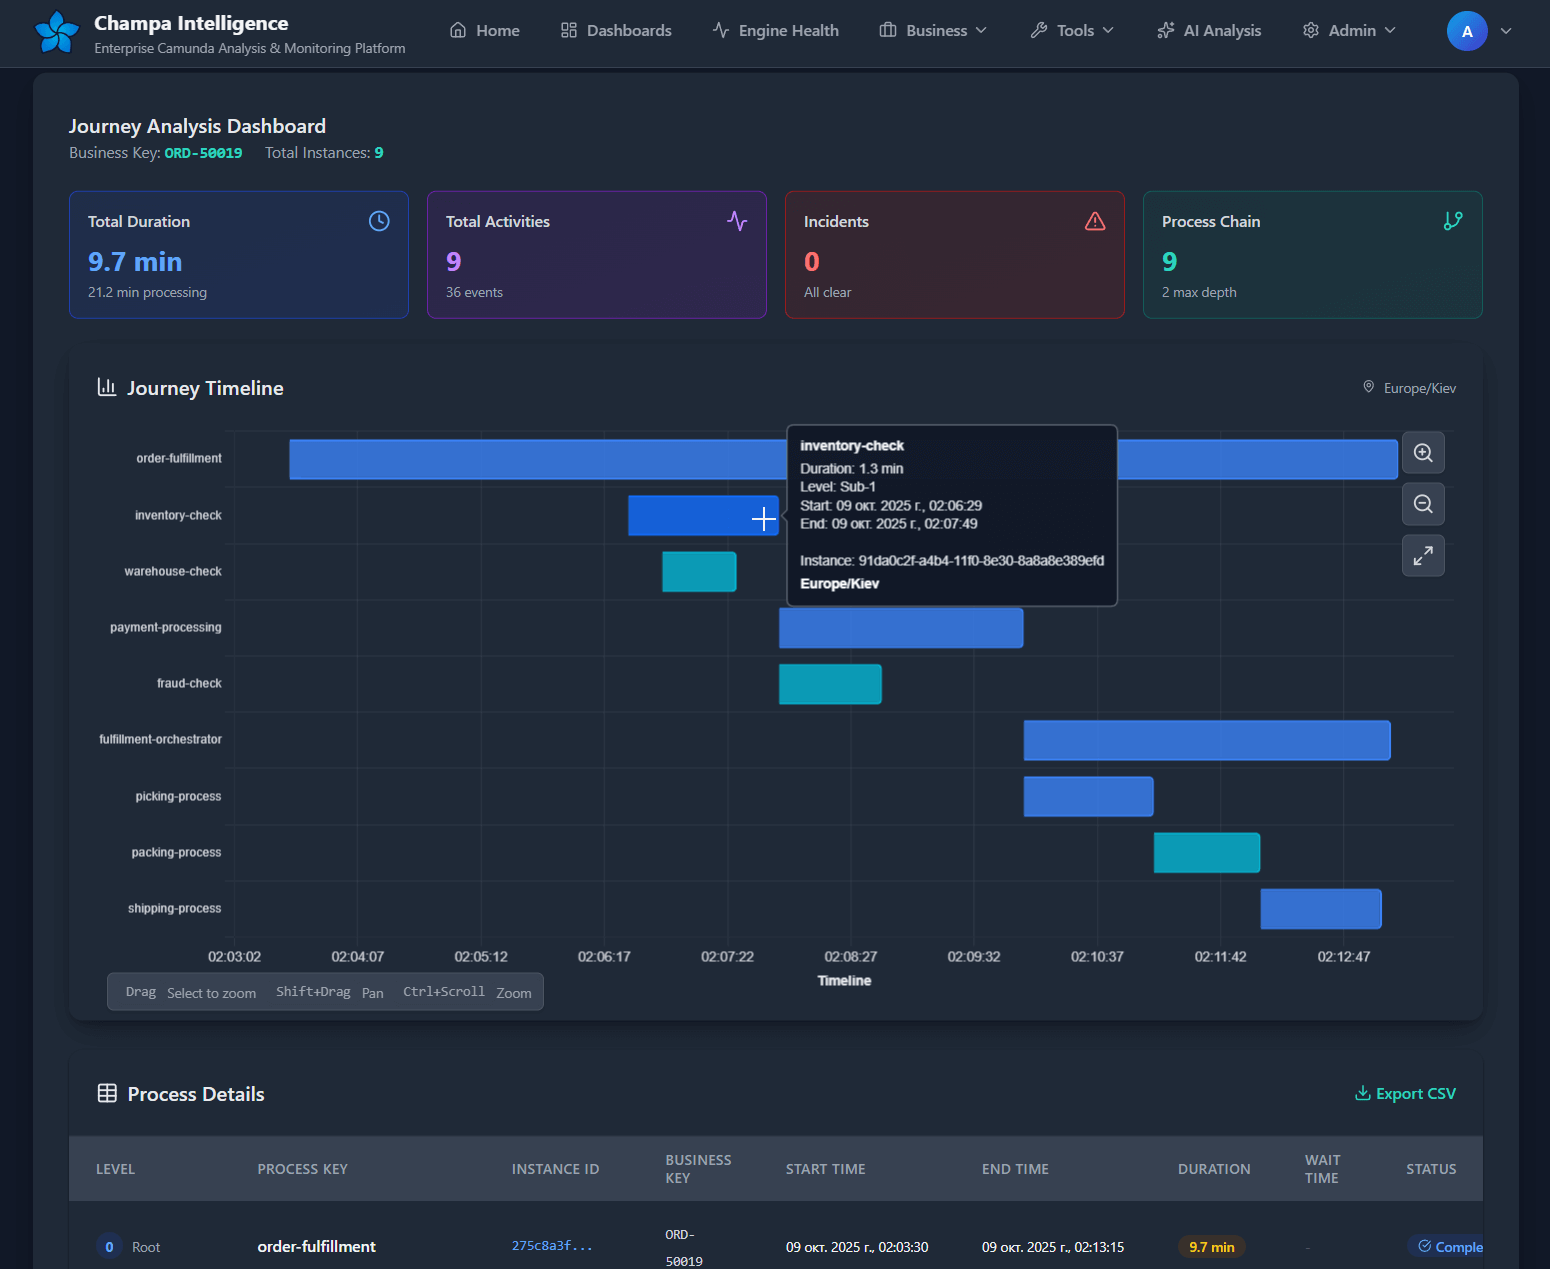
End-to-End Journey Tracker Cross-Process
Follow a business case across your entire process landscape. Parent/child, script-triggered—doesn't matter.
OrderEntry → CreditCheck → Inventory → Fulfillment → Shipping
Failed at CreditCheck. 4.2 days stuck. All context in one view.
Instance Timeline Detective Deep Dive
Every activity. Every variable change. Every decision. Complete audit trail in a few clicks.
With Timeline: 3 minutes. Click instance → see everything → done.
These Aren't Just Features. They're Time Back in Your Day.
per developer
with timeline
with AI analysis
Your team doesn't need more tools. They need the right tools. Tools that understand Camunda's complexity and respect their time.
Camunda 7 Reaching EoL? Don't Panic. Extend First.
Before rushing to Camunda 8, discover how to maximize your existing investment with modern observability, AI analysis, and developer tools. Migration can be strategic, not panicked.
Works with Any Camunda Database
While Champa Intelligence uses PostgreSQL for its analytics engine, it seamlessly integrates with Camunda deployments running on MSSQL, Oracle, MySQL, or any supported database.
- ✓ Maintains zero impact on your production Camunda database
- ✓ Syncs data in near real-time (2-10 second latency)
- ✓ Uses free, open-source replication tools (check your DB license for enterprise features)
- ✓ Takes 1-2 weeks to implement vs. months of query conversion
Transform Your Operations
Ready to Elevate Your Process Intelligence?
Join forward-thinking organizations using Champa Intelligence to transform their Camunda operations with enterprise-grade analytics, real-time monitoring, and AI-powered insights.
- Complete visibility across your entire Camunda infrastructure
- AI-powered insights that identify issues before they impact business
- Developer tools that eliminate hours of manual investigation
- Enterprise-grade analytics at a fraction of traditional costs
Getting Started
Feature Guides
Technical Docs
Licensing & Support
Complete Champa Intelligence documentation: docs.champa-bpmn.com | Open Source Alternative: Camunda Health Monitor | Follow us: LinkedIn • YouTube